

11 Dec Gold 2022 Week 50 Trading Plan
#Fintwit #XAUUSD #GOLD #MarketProfile #Orderflow #TradingPlan
This is my weekly outlook on GOLD. The levels that I will be looking at with a higher probabilistic chance the market will start reacting. During the session I then wait for the market to hit those levels and either confirm or reject my bias through price action confirmation and order flow. I hope that makes sense. If not, get in touch with me.
Monthly — Bullish
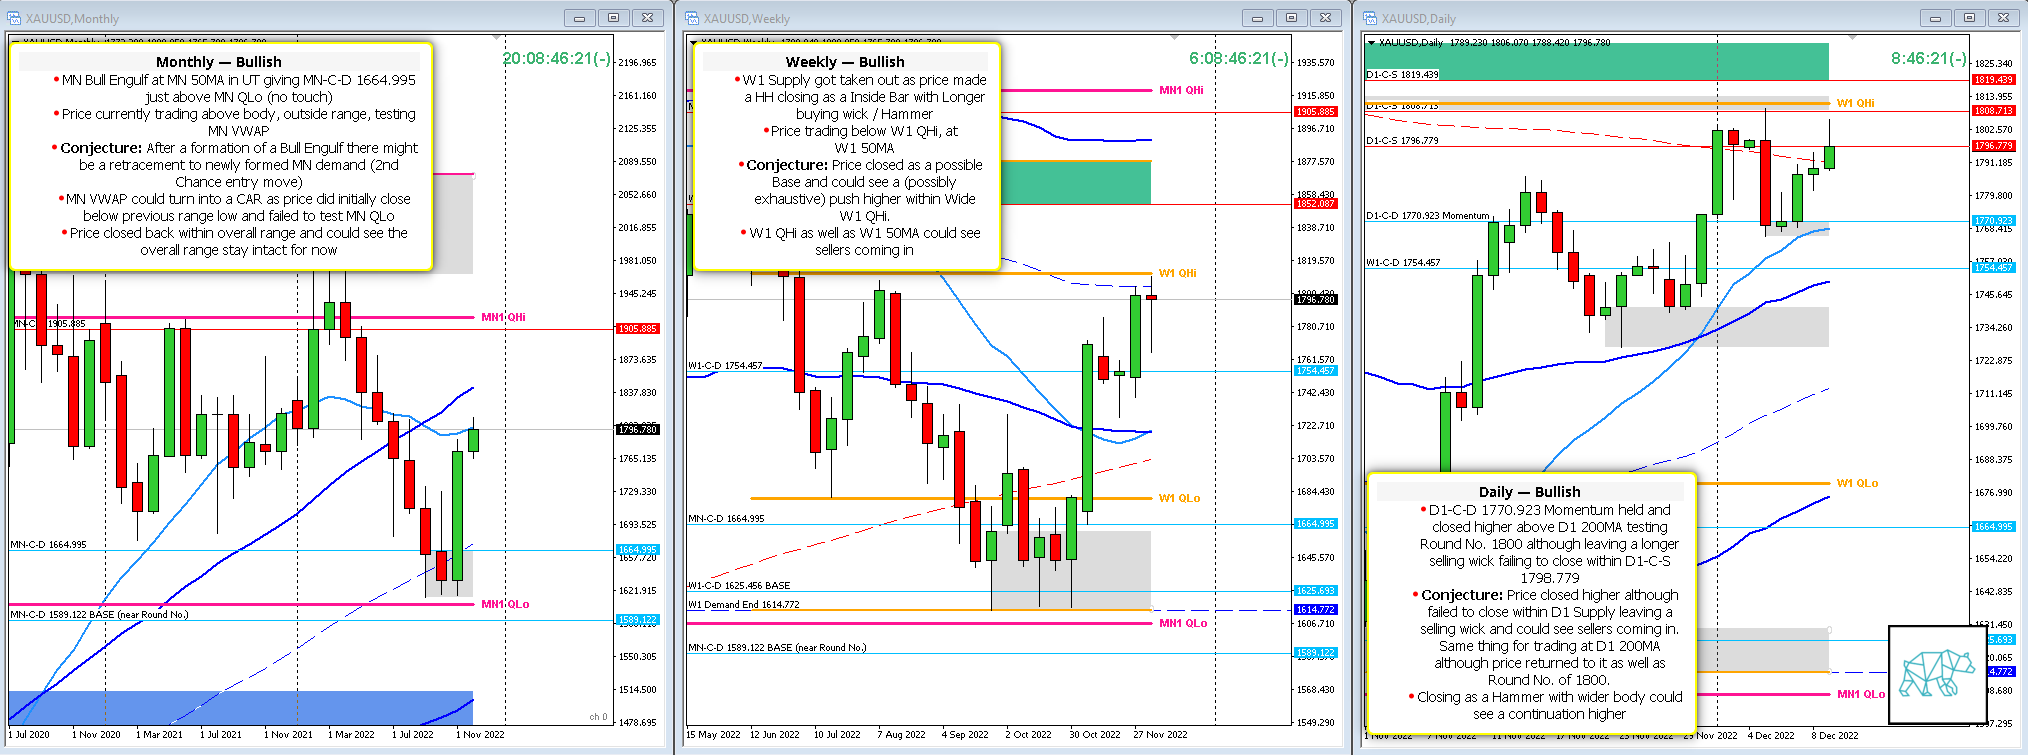
- MN Bull Engulf at MN 50MA in UT giving MN-C‑D 1664.995 just above MN QLo (no touch)
- Price currently trading above body, outside range, testing MN VWAP
- Conjecture: After a formation of a Bull Engulf there might be a retracement to newly formed MN demand (2nd Chance entry move)
- MN VWAP could turn into a CAR as price did initially close below previous range low and failed to test MN QLo
- Price closed back within overall range and could see the overall range stay intact for now
Weekly — Bullish
- W1 Supply got taken out as price made a HH closing as a Inside Bar with Longer buying wick / Hammer
- Price trading below W1 QHi, at W1 50MA
- Conjecture: Price closed as a possible Base and could see a (possibly exhaustive) push higher within Wide W1 QHi.
- W1 QHi as well as W1 50MA could see sellers coming in
Daily — Bullish
- D1-C‑D 1770.923 Momentum held and closed higher above D1 200MA testing Round No. 1800 although leaving a longer selling wick failing to close within D1-C‑S 1798.779
- Conjecture: Price closed higher although failed to close within D1 Supply leaving a selling wick and could see sellers coming in. Same thing for trading at D1 200MA although price returned to it as well as Round No. of 1800.
- Closing as a Hammer with wider body could see a continuation higher
Sentiment summary — Bullish
Additional notes
- N.A.
Focus Points for trading development
- Monthly Goals
- Use SL scaling
- 1st DTTZ Gold
- 2nd DTTZ DAX
juan l.
Posted at 13:29h, 12 DecemberGood Evening T3ch sir,
Thanks for your responses last week. Im so glad i can speak to a trader in real-time and see your thought process. I don’t intend to copy you but take from your thought processes and Market Stalker methodology to form my own style. With that being said here are my questions/concerns.
1. what do you mean by “Price currently trading above body, outside range” on the Monthly TF?
2. How significant is it the fact that the Monthly Qlo was not touched ?
3. Does the Width of a High/Mid/Lo TF Q point indicate the probability of it being tested or accepted ?
4. On the Weekly TF the supply was taken out by a Bullish engulfing but it met resistance. is it safe to conclude that the supply being taken out with momentum gives the stronger probability of acceptance into the Qhi ? Personally my bias right now is no bias. that bearish candle from last week makes me want to wait for this weeks candle to see if there is any additional momentum left behind the move. Do you agree/disagree ?
5. what is the Dotted red line ?
6. On the Daily. Price has tested and closed below a C‑D. Do you still want to see acceptance of the W/D Qhi and a Rejection candle pattern for your bias to flip Bearish ?
Broil my brain please
juan l.
Posted at 13:44h, 12 DecemberHere’s an interesting point. Weekly demand was NOT taken out on Gold futures. Will this affect your analysis ? or will you just stick with data from spot Gold ?
T3chAddict
Posted at 07:24h, 13 DecemberHi Juan, my pleasure. You ask good questions so keep ’em coming.
1. The candle has a body and a wick. The wick represents the range. Either selling or buying range. So I look where the developing price is in relation to that. You have to place it within context though. Meaning with all the other TF as well as the cycle of the developing candle ie. beginning, middle, end of the month/W1. This is my own sauce that I pour over my TA and I do not suggest you to incorporate it into your own education as you should first learn the MS method. And like you said come up with your own approach. I’ll be more than willing to expand further on this in the future though.
2. That could mean 2 things. Price is going to go back and test it. OR. Price found so much momentum before that level that it reversed. In terms of significance I’d say it on its own isn’t that significant. When you put it in perspective with the W1 and D1 timeframe you can get a better picture of what’s going on. We trade what’s in front of us the rest us up to the gods ie instituation traders 🙂
3. If you are referring to the width of the swing High/Low yes it does. If the Swing High/Low is narrow it is more probable (not guaranteed, because you always need to place it within context of the overall market) that price could test and reverse than it is with a wide swing high/low. If it’s wide it could rather see a continuation OR at least a deeper ‘penetration’ before starting to react.
4. I agree that we need more information.. So with the preceding rally to then form a possible base could suggest another rally coming up forming a RBR. Wide W1 QHi could further suggest a possibility for a deeper penetration as I suggested before. The fact that W1 supply got taken out usually sees some reaction before there is a continuation. However, sometimes these areas get popped to find liquidity to then reverse in the opposite direction. Which in thise case could form a W1 Three Outside Down formation. So just looking at the W1 yes more info is needed although with a slight nod to bullish as also no reversal has printed yet. We always need price to confirm before we shift bias. MN is early in its development and even though it made a HH as opposed to the previous month it was a large move (as well as trading at MN VWAP) and could see a retracement causing a shorter term reversal on W1. So yes. More information is needed.
5. I believe you are referring to the RED “striped dotted” line’ these are the 200MA for their respective TFs.
6. No, when price fails to close WITHIN a Supply/demand zone it usually means there aren’t enough participants around to push the price deeper hence the opposition could take over. With the power of hindsight at the moment we can see that that is exactly what happend. The reason why I had not flipped it to bearish is that price action had not yet formed a reversal. Hence, the conjecture around the level. That I then later will take with as a piece of information putting it within the contexst of LTF as well as open sentiment to form a better undertanding.
7. No, I do not look at any other chart but the charts pertaining to the instrument I am trading. So yes I just stick with the data of my own chart. Everything else to me is irrelevant. Having said that when equities and gold seems to be moving in tandem I take note of that but often the opposite is the case.
Brain boiled?
T3chAddict
Posted at 08:58h, 13 DecemberAddition to number 1: A further implication of trading within a range is that there are still buyers/sellers around that could push prices. So going long into a selling wick (upper range) is more likely to encounter some congestion than not. This is just another piece of information that you can take into your TA. How this information translates into the MTF/LTF is something that you can see through price action reading and of course experience.