Physical Address
304 North Cardinal St.
Dorchester Center, MA 02124
Physical Address
304 North Cardinal St.
Dorchester Center, MA 02124
In order to know how to trade futures, or any financial instrument for that matter, it’s important to know the history. In particular the historical data on the behavior of price action.
History belongs to the victor
They say ‘history belongs to the victor’, well I hope that’s true about trading. Many professional traders mention that history in trading tends to repeat itself. If we believe this to be true then it would mean we stand to benefit from analyzing past price action. Yet, I find it hard to find any approaches on how to analyze just this. So is this, because it’s not important, or have I just found the ‘holy grail’ of trading? Let’s find out.
Not Backtesting (yet)
I see traders talking about how valuable it is to do backtesting and I do agree. Once you have a strategy that is. But what if you don’t have a strategy yet. What do you do then? I know most people look to others to find answers. But what if you can go out and find them for yourself. That’s my purpose with analyzing past price behaviour. I can’t find anything on this on Google. The only thing that comes close to it is backtesting. But as I mentioned before. If you don’t have a strategy to test it back on, why not start by just observing past price action to potentially come up with a strategy?
Past Price Action Analysis (PPAA)
PPAA is what I’m calling it for now. I know, cool name right 😉 My intention is to observe past price action based on certain criteria. My goal with this is to find patterns in how a certain financial instrument is traded and ultimately find my strategy of trading them. So how do I go about this?
Setting the criteria
Many traders have made up their minds on what works for them. There seems to be a division between the ones that prefer technical analysis and the ones preferring fundamental analysis. I believe that whatever works for you, is your truth. I have no right to say that one is better than the other because nobody can make such a statement. Your trading style and the timeframes you are trading in define the flow of information analysis that lead you to make a ‘prediction’ of that particular situation. The way you process that information is a big part of that flow. So how do we set these criteria? Well, that’s up to you really. By this point you might already know some tools or indicators on trading I suggest you start with these. I can only tell you what I am starting with.
Exciting stuff!
Let’s get down to do some price action observing! Sounds exciting?! Probably not. However, I do believe to get good at anything you need to first understand it. How can we start? Take a look first and fill your brain with lots of data. Then draw conclusions from your data and then test your conclusions to see if you can replicate them. I simply categorize these as, Observe, Analyze, Test. But before we get started. It might help to know why we are doing this in the first place. I present to you… the goal.
Pattern hunting
In order to know how something behaves. In this case price action. We need to look at it. Sounds simple right? Stay with me. Before we can see patterns we need to collect the data. Then we need to process this data in a way that makes sense. And only then… we get to glance upon our work and try to pick the fruits of it. At the very least, we will have a more in-depth understanding of the market.
Observe
To understand how the technicals and fundamentals behave in a market we need to have an approach for learning these. At this point I assume that you already know what the differences between these two are. In short, technicals is all about what information you can find in the charts, whereas the fundamentals are things like supply and demand numbers, basically what they talk about in the news (not correct for all financial instruments, but go on and Google it). Furthermore, I assume that you know the very basics of the following:
There are many others that I know but I am going to start with these. Believe me this is already a lot of data to be collecting and processing.
So where to start looking?
In this part we are going to fill that magnificent brain of ours up with information. In order to do that we need to first set the parameters. Parameters like:
Time Period
I didn’t base the time period I was going to observe and then analyze on a certain amount like 1, 2 or more years. I did this purely based on visual information of the daily chart that I looked at. This is the chart I was looking at.
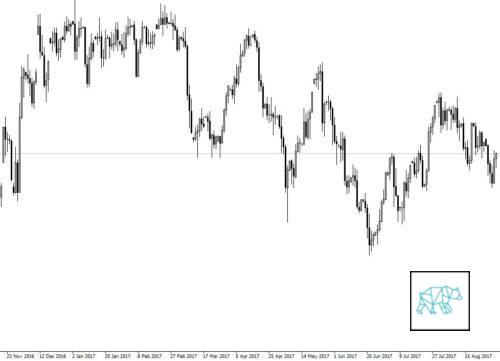
What stands out?
Immediately when looking at this chart I noticed some points that drew my attention. Points where prices would ‘hover’ for a bit and points where they reversed only to go back down just as fast they went up. If they aren’t clear to you already, here is what I meant.
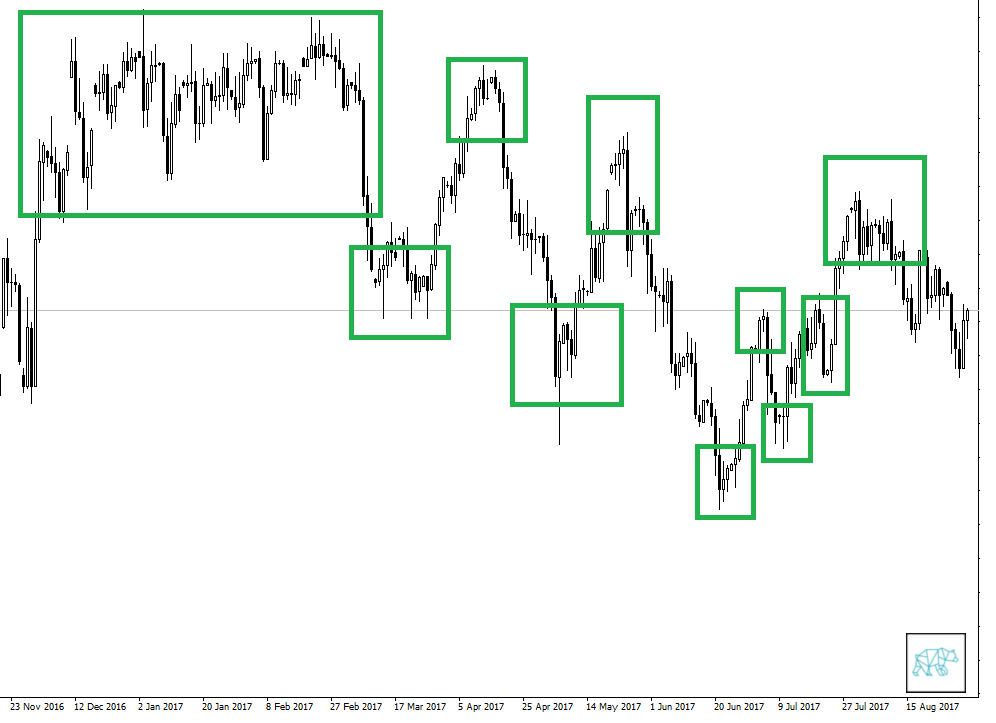
What’s going on?
I looked at these points and thought to myself ‘what’s going on at these points?’. What drove prices to behave in this way. So I set out to find out. But before we can reach to any conclusions we need to know how we’re going to measure.
How to measure
For all these points of interest I concluded that I need to find a way to measure them and therefore I need to ask myself what do I want to know? This is what I came up with.
Since trading is a very individualistic endeavour I leave to you from which points to which you would like to measure. For example, some people measure from the end of the candlestick wicks and some from the ‘real body’.
So how we get down to choosing the right tool. Let’s break it down per point as discussed above.
Candlesticks
In order to know what candlestick formations there are we need to know about them in the first place. Don’t know yet? Google! Alright alright… here I’ll make your life a little easier. CLICK HERE :)
Measuring tool
Every charting software has a tool with which to measure moves with. In Metatrader 4 it is this tool:
This tool will measure the distance in height (pips) distance in width (time) but also tell you what times they occurred.
Fibonacci Retracement Tool
Every self-respecting charting software should give you the use of the Fibonacci tools. With these tool we are going to measure the retracements of certain moves to see if we can find patterns in these as well.
Now that we have established what we are going to measure and with which tools to measure them with. We are going to… you guessed it… do the ‘dirty’ work and actually do the work. In another post I will discuss how to process the information, if you haven’t found patterns yourself already that is. And I will tell you how I will test my conclusions. For now I leave you with this because it cannot be emphasized enough…….
If you have any questions or comments or just want to call me a d*** be my guest and leave your comments. If I can, I’ll always help anyone reaching out.