Physical Address
304 North Cardinal St.
Dorchester Center, MA 02124
Physical Address
304 North Cardinal St.
Dorchester Center, MA 02124
Firstly, I am going to look at the 4-hourly chart over a time period extending beyond a year. The principle of using moving averages is that you take 3 different moving averages and see if you can find a trend. This will hopefully help with coming up with a trading strategy. For my first ‘test’ I am using the 20 period, 50 period, and 200 period simple moving average. There are different moving averages like simple and exponential etc. If you don’t know what these are you can GOOGLE them and most likely you haven’t really tried learning much about trading and are looking for others to tell you the ‘holy grail’. Stop slacking bro/sis and go get your share in the world.
Simple moving averages
So I have plotted the green 20, the blue 50, and the gold 200 SMA and what I am going to look for is a cross over or under the bigger moving averages. Idea is that when the 20SMA is over the 50SMA, AND over the 200SMA, that’s a very bullish trend and one should go long. Now let’s see if we can find some patterns.
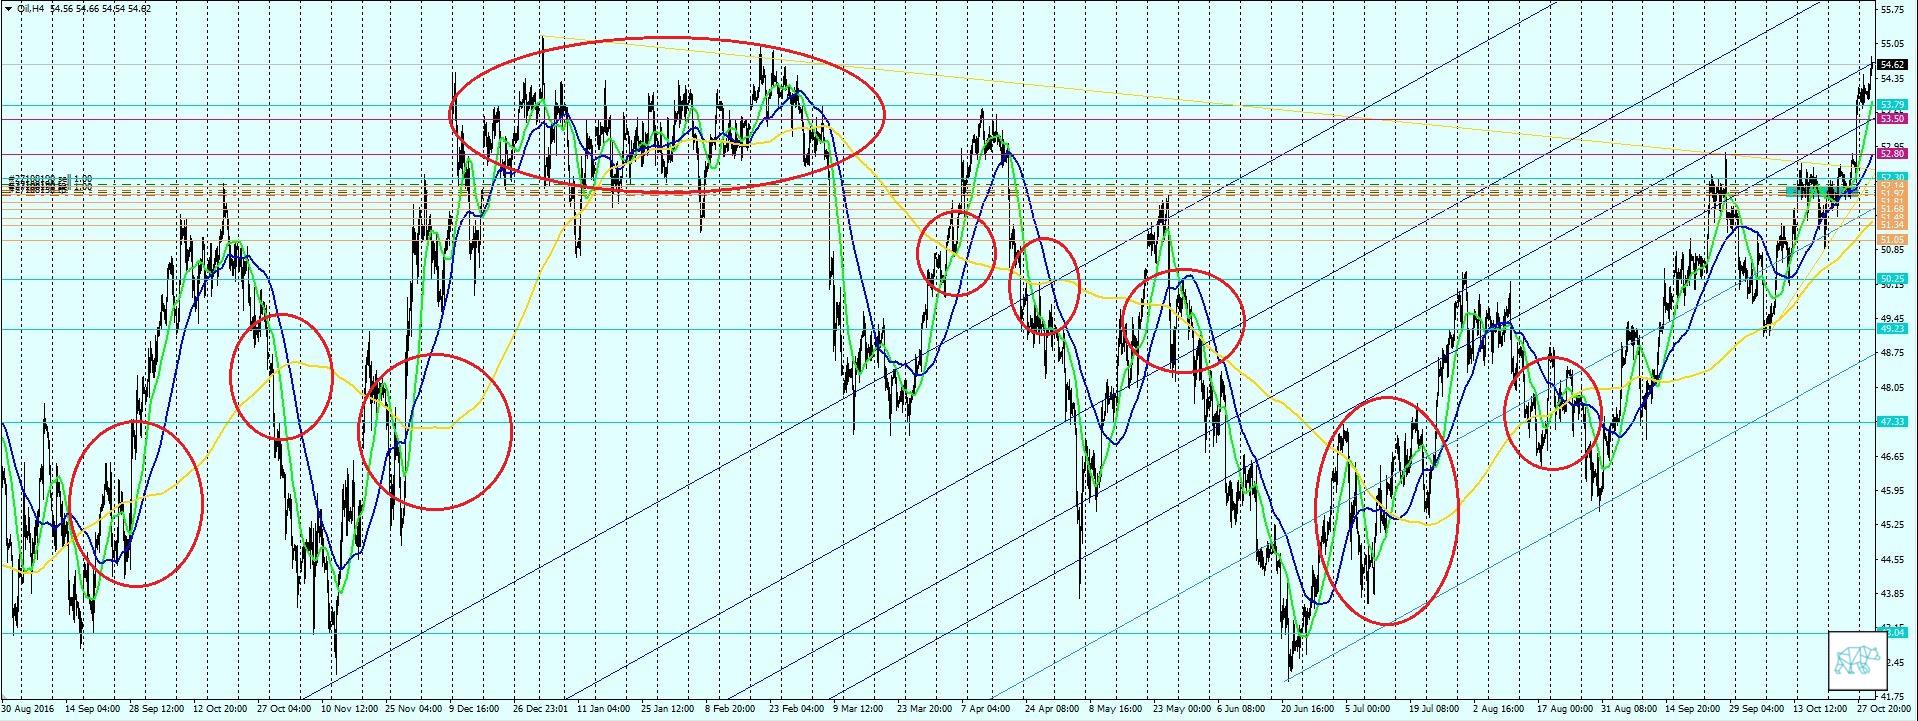
As you can see I have circled the cross over and unders and I’ll be having a look at them from the left to the right.
No. 1
The first one we can see that both the 20 and 50 were under the 200 SMA. Then the 20 crossed over the 50, then they both crossed the 200 signaling a bullish trend. After which prices indeed went up for a while. Then the 20 started touching the 50 that could be indicating loss of momentum and finally crossing under the 50. Then it stayed under the 50 until they both crossed the 200.
Lesson
When the 20 crosses the 50 and then they both cross the 200 I should only go long to not having to deal with prices getting away with me on a position I took in the wrong direction. However, this is just the first one so let’s look at some more.
No. 2.
After its decline they both sharply crossed the 200. Just before it did though we can see there was a ‘stutter’ and then it continued its way down. This is more of a drop then others we’ll see later. At the bottom we can see another point where the 20 touches the 50 before in the end it crosses it. Again a loss of momentum in my opinion.
Lesson
When the 20 and 50 are far away from the 200 and the 20 crosses down under the 50 we can expect a move towards the 200. Then when they both break the 200 we can see a significant move down. When there’s a big momentum push behind the move the 20 will touch the 50 before crossing it indicating a reversal.
No. 3
Here we can see that the 20 crossed the 200 but the 50 hadn’t yet. So after the 20 crossing the 200 it pretty much immediately went back down to meet with the 50. After which the 50 caught up and they both crossed the 200 signaling another bull run. On this run we can see that the 20 is touching the 50 several times but is staying on the bull side of it until it actually breaks it in the first week of January.
Lesson
Both the 20 and 50 have to cross the 200 before indicating a valid trend bull or bear.
No. 4
This one seems significant because of the fact that it looks like a period of just consolidation. The 20 hovered over the 50 and the 50 over the 200. Sometimes the 20 would cross the 50 but not the 200. Only at one point did the 20 cross the 200 but again not the 50 so no real reversal could be indicated. Then they both broke the 200 at the same time and signaled in a bearish move.
Lesson
It looks like prices overextended and tried to go to new levels but the 200 seems to pull prices back to its mean. If prices stay over the 200 and there’s no discernible trend than we should assume that prices are consolidating at this level indicating a new period of a big trend.
No. 5, 6, 7
Similar to no. 1 and 2.
No. 8
This is another interesting one. We can see that after the 20 and 50 have dipped and overextended as opposed to the 200 then to see them return. The 20 touches the 200 and returns to the 50 who is trying to play catch up. THe 20 breaks the 50 circles back up and both the 20 and 50 cross the 200 at about the same time.
Lesson
After this move we have seen a bullish trend evolve so could this be the indicator for just that? A true reversal in trend. Almost a similar break at no. 4 happened but not as closely tied. This could however be because of the consolidation period prior to it. Another thought is that because moving averages are lagging indicators (meaning they are late to the ‘party’) so this occurrence could just be because at that point we are turning in a new direction. But then when we look at number 9 we seen a similar thing.
No. 9
Could this be considered a confirmation of number 8 indicating the reversal of the trend actually confirmed. BEcause here the moving averages are very close indeed as well. Or could it be that after having a few ‘dropping’ cross over and unders that when the crosses become tight we can see a reversal?
Lesson overall
I think it is very interesting to see how moving averages behave. These are the moving averages on the 4-hourly chart though so I still want to look at smaller timeframes to see if we can find some patterns there as we found here. But the thing I am more interested in is if we can find some patterns on the 30-minute chart that indicate a confluence with the bigger time frame.
As always thank you very much for reading. And please leave a comment on your journey to become a trader. Ask me anything you like or just troll me for being an idiot for finding my ‘own way’ in trading.